SentryAtlas — Real-Time Disaster Monitoring
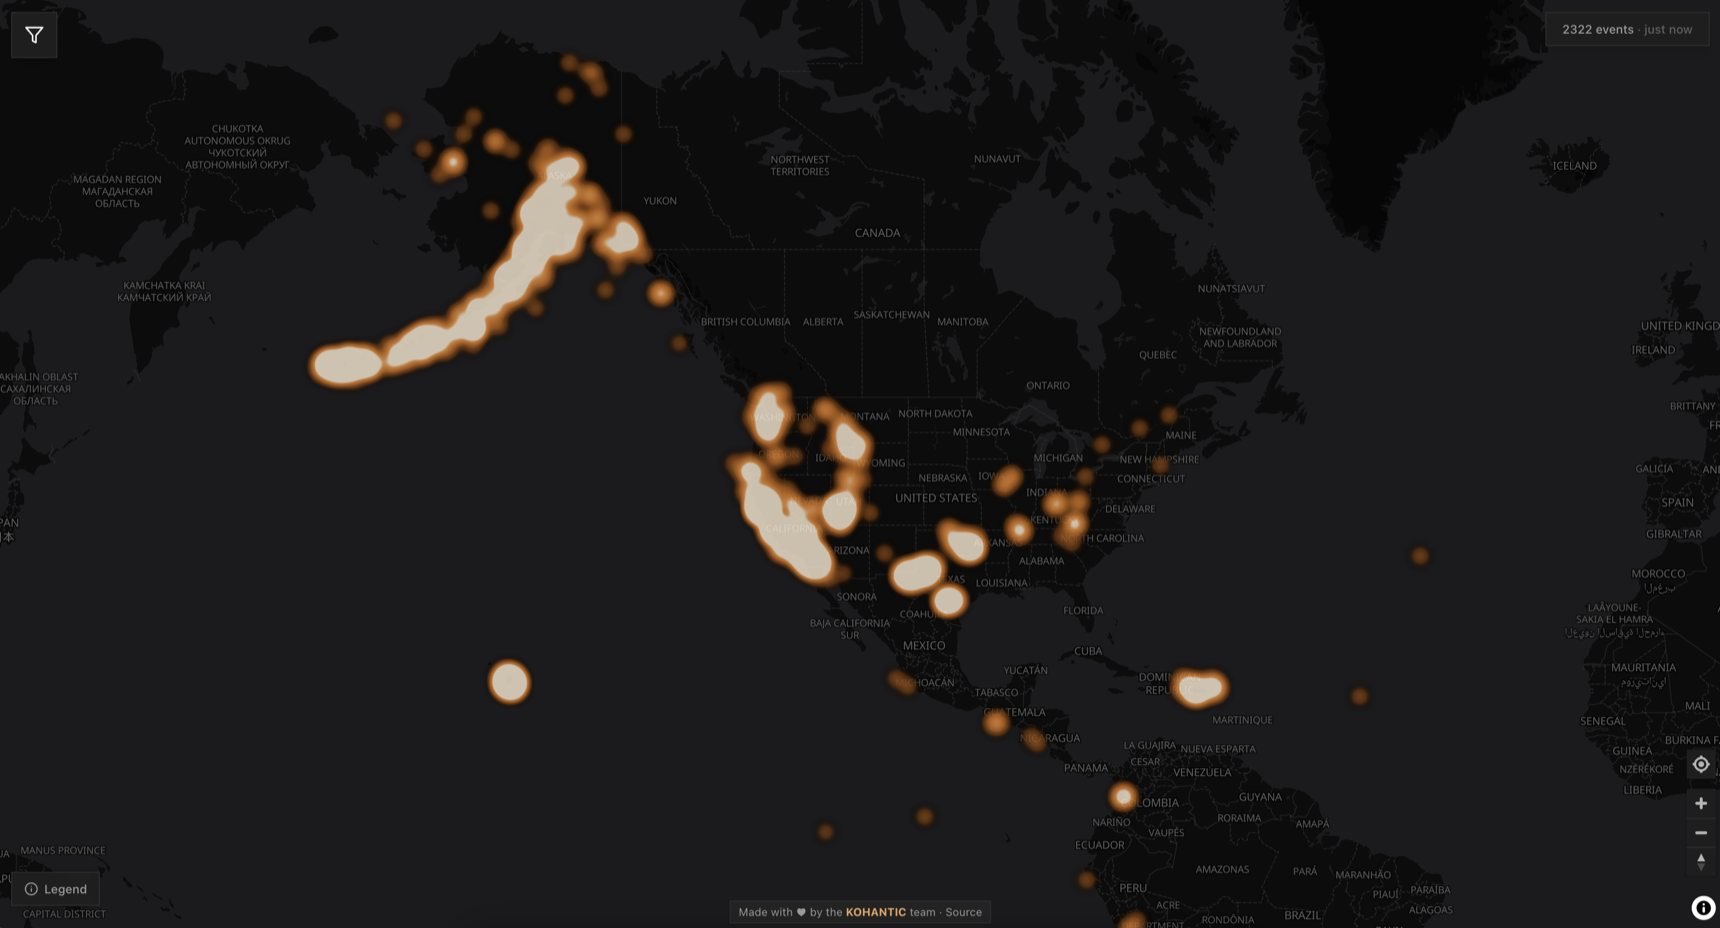
Seven days of global events. The Ring of Fire draws itself.
SentryAtlas puts every natural disaster it can find onto one map. Earthquakes, wildfires, floods, storms, cyclones — fifteen event types pulled live from four public agencies, normalized into a single shape, and plotted together. No account, no API key, no tracking. It is open source under the AGPL and lives under my company's GitHub organization.
The Problem
The data already exists and is already free. USGS publishes earthquakes, NASA EONET tracks wildfires and volcanoes, NOAA issues weather alerts for the US, and GDACS covers global disasters. The catch is that each one models the world differently — different schemas, different category names, different date formats, different ideas of what a location even is. Watching all four means opening four sites and reconciling them in your head. SentryAtlas does that reconciliation once, in one place.
How It Works
The Go backend fans out to all four sources concurrently and caches each one separately, so a slow provider never blocks a fast one and identical concurrent requests collapse into a single upstream call. Each adapter translates its source into one shared event model — an ID, a type drawn from a fixed registry, coordinates, a time, and a severity — which is what makes fifteen different phenomena from four different agencies filterable through the same controls.
The map does not wait for the slowest government API before showing you anything. The backend streams over Server-Sent Events, emitting one batch per source the moment it lands, so earthquakes appear while the weather service is still thinking. A final frame reports the status of every upstream — which matters more than it sounds, because it lets the map say NOAA is down, this is partial instead of quietly showing you a calmer world than the real one.
The Details That Took the Longest
Aggregation problems are mostly edge cases, and the edge cases here are geographic. A NOAA
alert often covers a named region rather than a point, so roughly 85% of them arrive with no
coordinates at all. Those events are real and worth returning, but they cannot be drawn and
they are not inside any bounding box — get that wrong and every regional query in the world
silently includes a few hundred phantom events, or worse, drops them all at 0,0 in the Gulf of Guinea. They now come back as geometry: null, which is what GeoJSON actually says to do.
The other recurring theme is that public feeds are untrusted input. GDACS ships HTML inside its
descriptions, so nothing from a feed is ever interpolated into markup — popups are built as DOM
nodes with textContent, which makes the whole class of injection impossible
rather than merely unlikely. Unknown event types are rejected at the edge instead of flowing into
cache keys, since a public endpoint that mints a new cache entry and a new upstream fetch for
every junk parameter is a memory-growth and amplification vector wearing a trench coat.
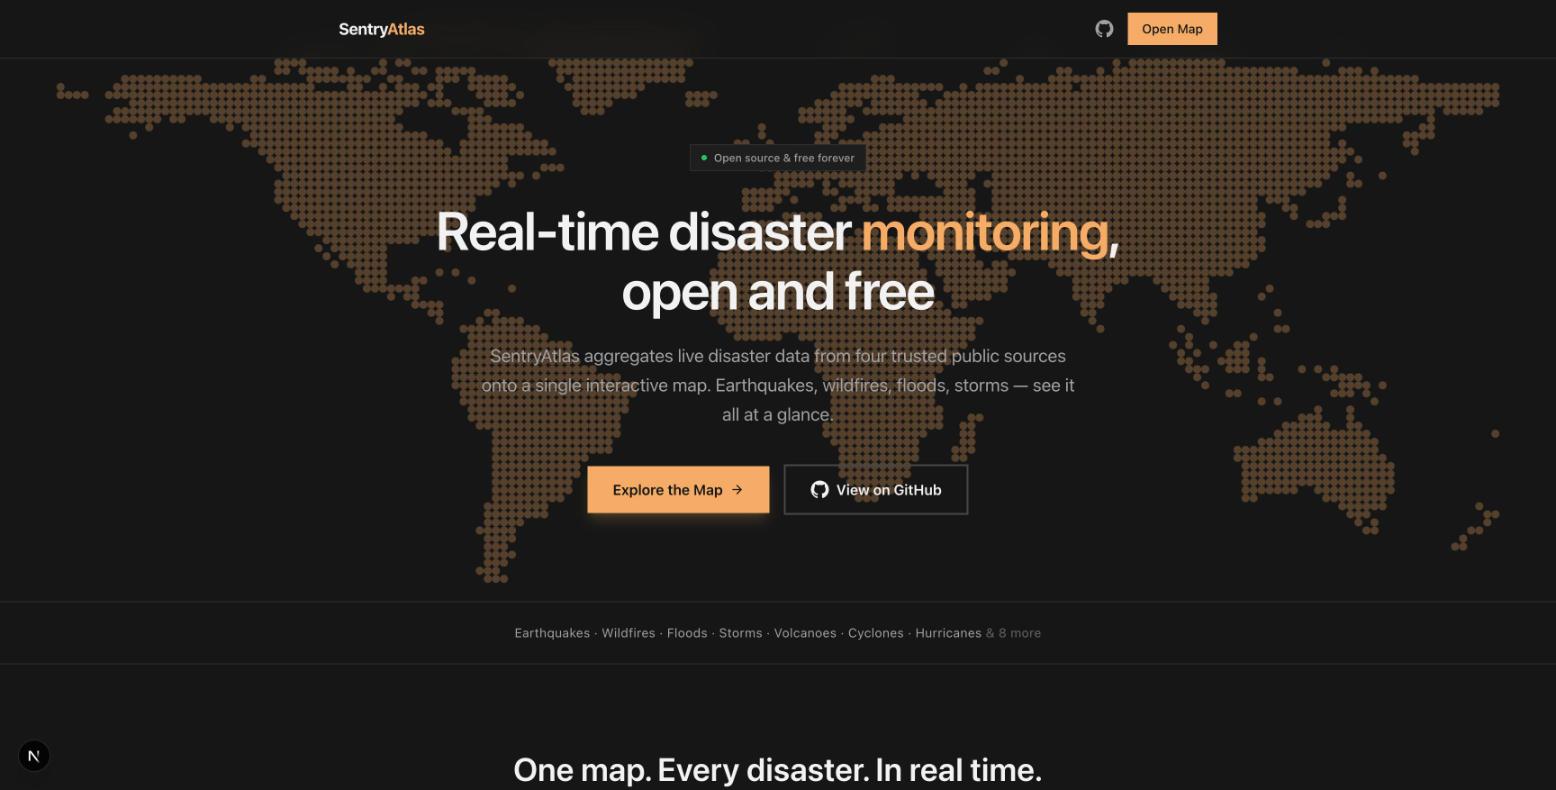
sentryatlas.com
How It's Made
Three pieces in one repository. A Go API using chi, with an in-memory TTL cache, singleflight for request collapsing, per-IP rate limiting, and gzip on the
way out. A Next.js map built on MapLibre GL, which streams events in and filters by type, time
range, and viewport. And a static Next.js landing site. Both applications ship as non-root
Docker containers on DigitalOcean App Platform, deployed from committed specs rather than
console clicks.
The event palette is the part I did not expect to spend time on. Fifteen categories is more than a colour scheme can carry honestly — I optimized the hues against the dark background so the worst-separated pair of all seventy-eight combinations still holds a measurable perceptual distance, and every colour clears contrast against the surface. Even then, fifteen categories cannot be told apart by colour alone, so type is always named in the legend, the filter panel, and the popup. Colour narrows it down; the label settles it.
Take a Deeper Dive
The API is documented and usable on its own — one endpoint, GeoJSON or JSON or an event stream, no key required. The GitHub repo has the full tour, including how to run the whole stack locally.
TL;DR
I built a live map of natural disasters worldwide, aggregating four public agency feeds into one open API and one map. See it at map.sentryatlas.com.